/admin/transcripts (admin_transcripts_conversations)
Permission: comerix.insights.history
History has two surfaces that work together:
- Conversations — the customer-facing thread: every message exchanged, the variables collected, and telemetry, grouped by visitor.
- Executions — the engine-facing record: each time a flow ran, node by node.
Conversations vs. executionsA conversation is one ongoing chat with a customer. An execution is a single run of a flow. One conversation can contain many executions — each trigger that fires while the customer chats starts a new execution against the same conversation. Start in Conversations to see what the customer experienced; open Executions to see how the engine behaved. See Lifecycle for the full status model and Concepts for the vocabulary.
Browse conversations
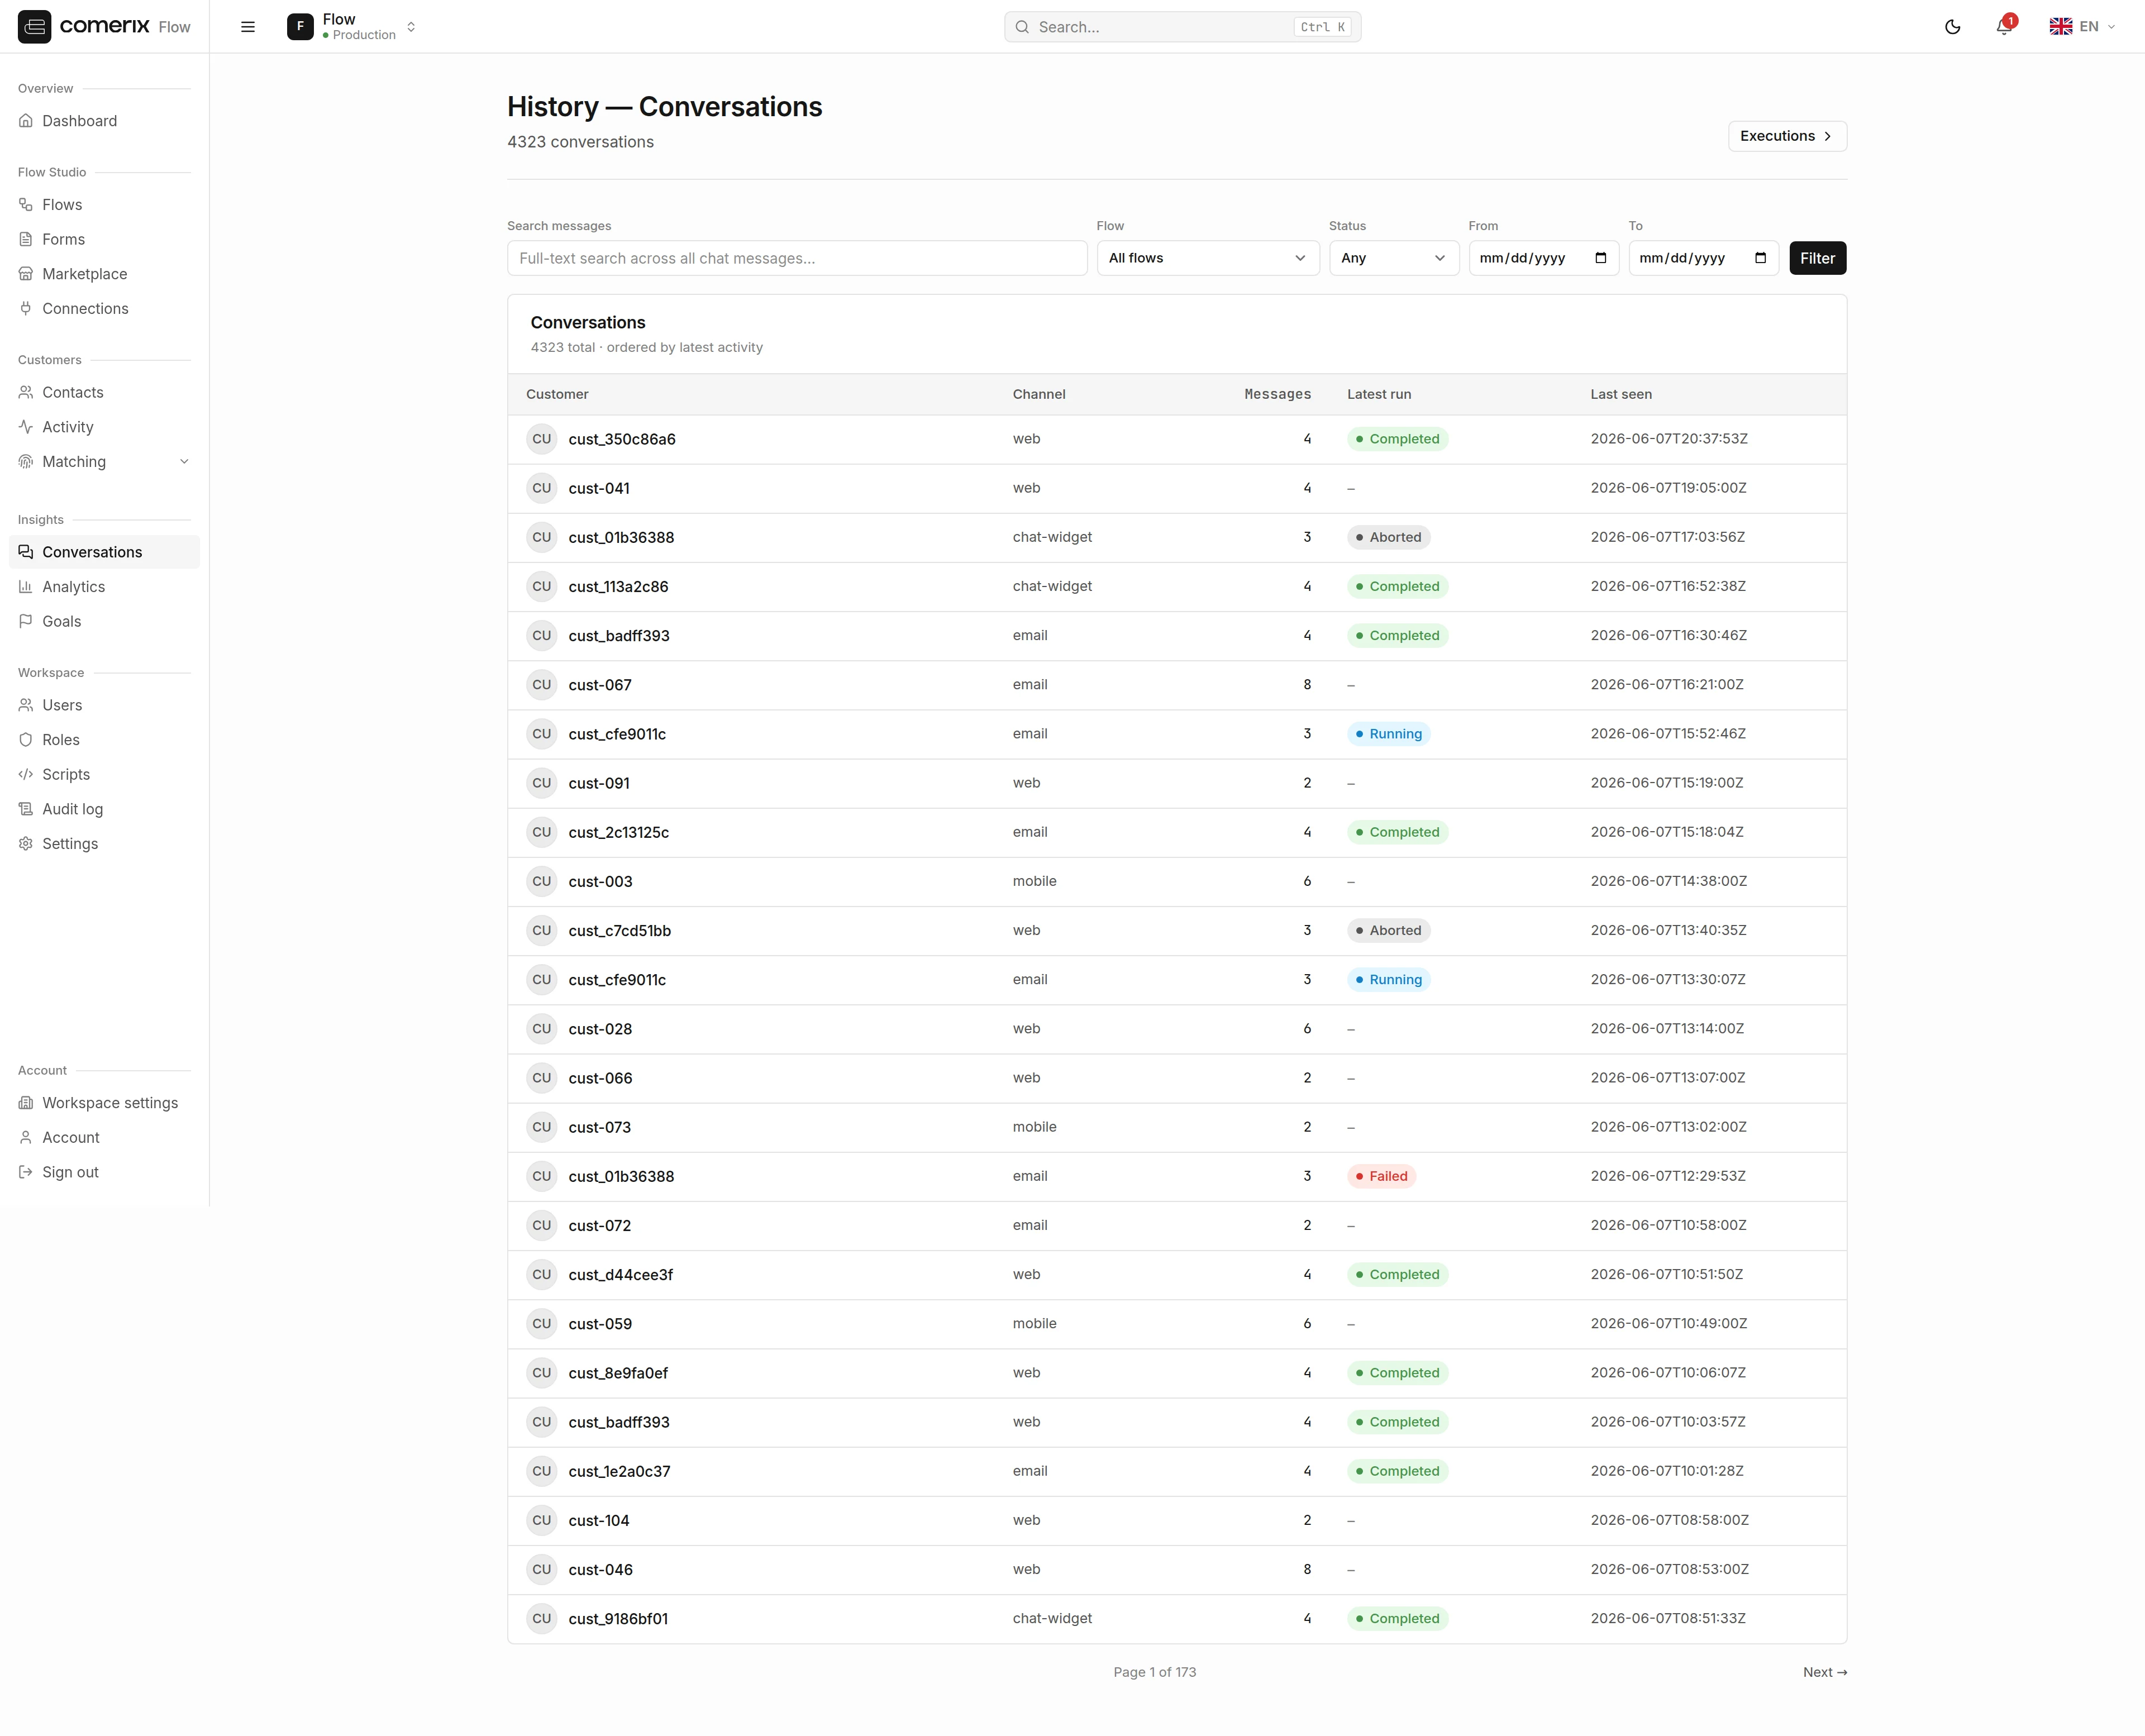
/admin/transcripts) is paginated at 25 per page. Use the filters to narrow it down:
Empty conversations are hiddenThe list only shows conversations that carry at least one chat message. A visitor who opened the widget and produced only telemetry (page views, scrolls) but never exchanged a message has nothing to replay, so that telemetry-only conversation is omitted from the list. It still contributes its signals to Goals and analytics.
| Filter | What it does |
|---|---|
| Flow | Show only conversations that ran a specific flow |
| Status | running, waiting_input, waiting_time, completed, failed, aborted |
| Date range | Limit to conversations seen within a window |
| Column | Meaning |
|---|---|
| Customer | The identified customer, or (anonymous) for unknown visitors |
| Channel | Where the chat happened (e.g. the web widget) |
| Messages | Number of messages in the thread |
| Latest run | The most recent execution for this conversation |
| Last seen | When the customer was last active |
Search across messages
Use the full-text search box to find a conversation by what was said in it. Search runs across the text of all messages. The results panel shows matching message snippets with the matched words highlighted. Click a result to jump straight into that conversation, positioned at the matched message — handy when you remember a phrase but not the customer.Read a conversation
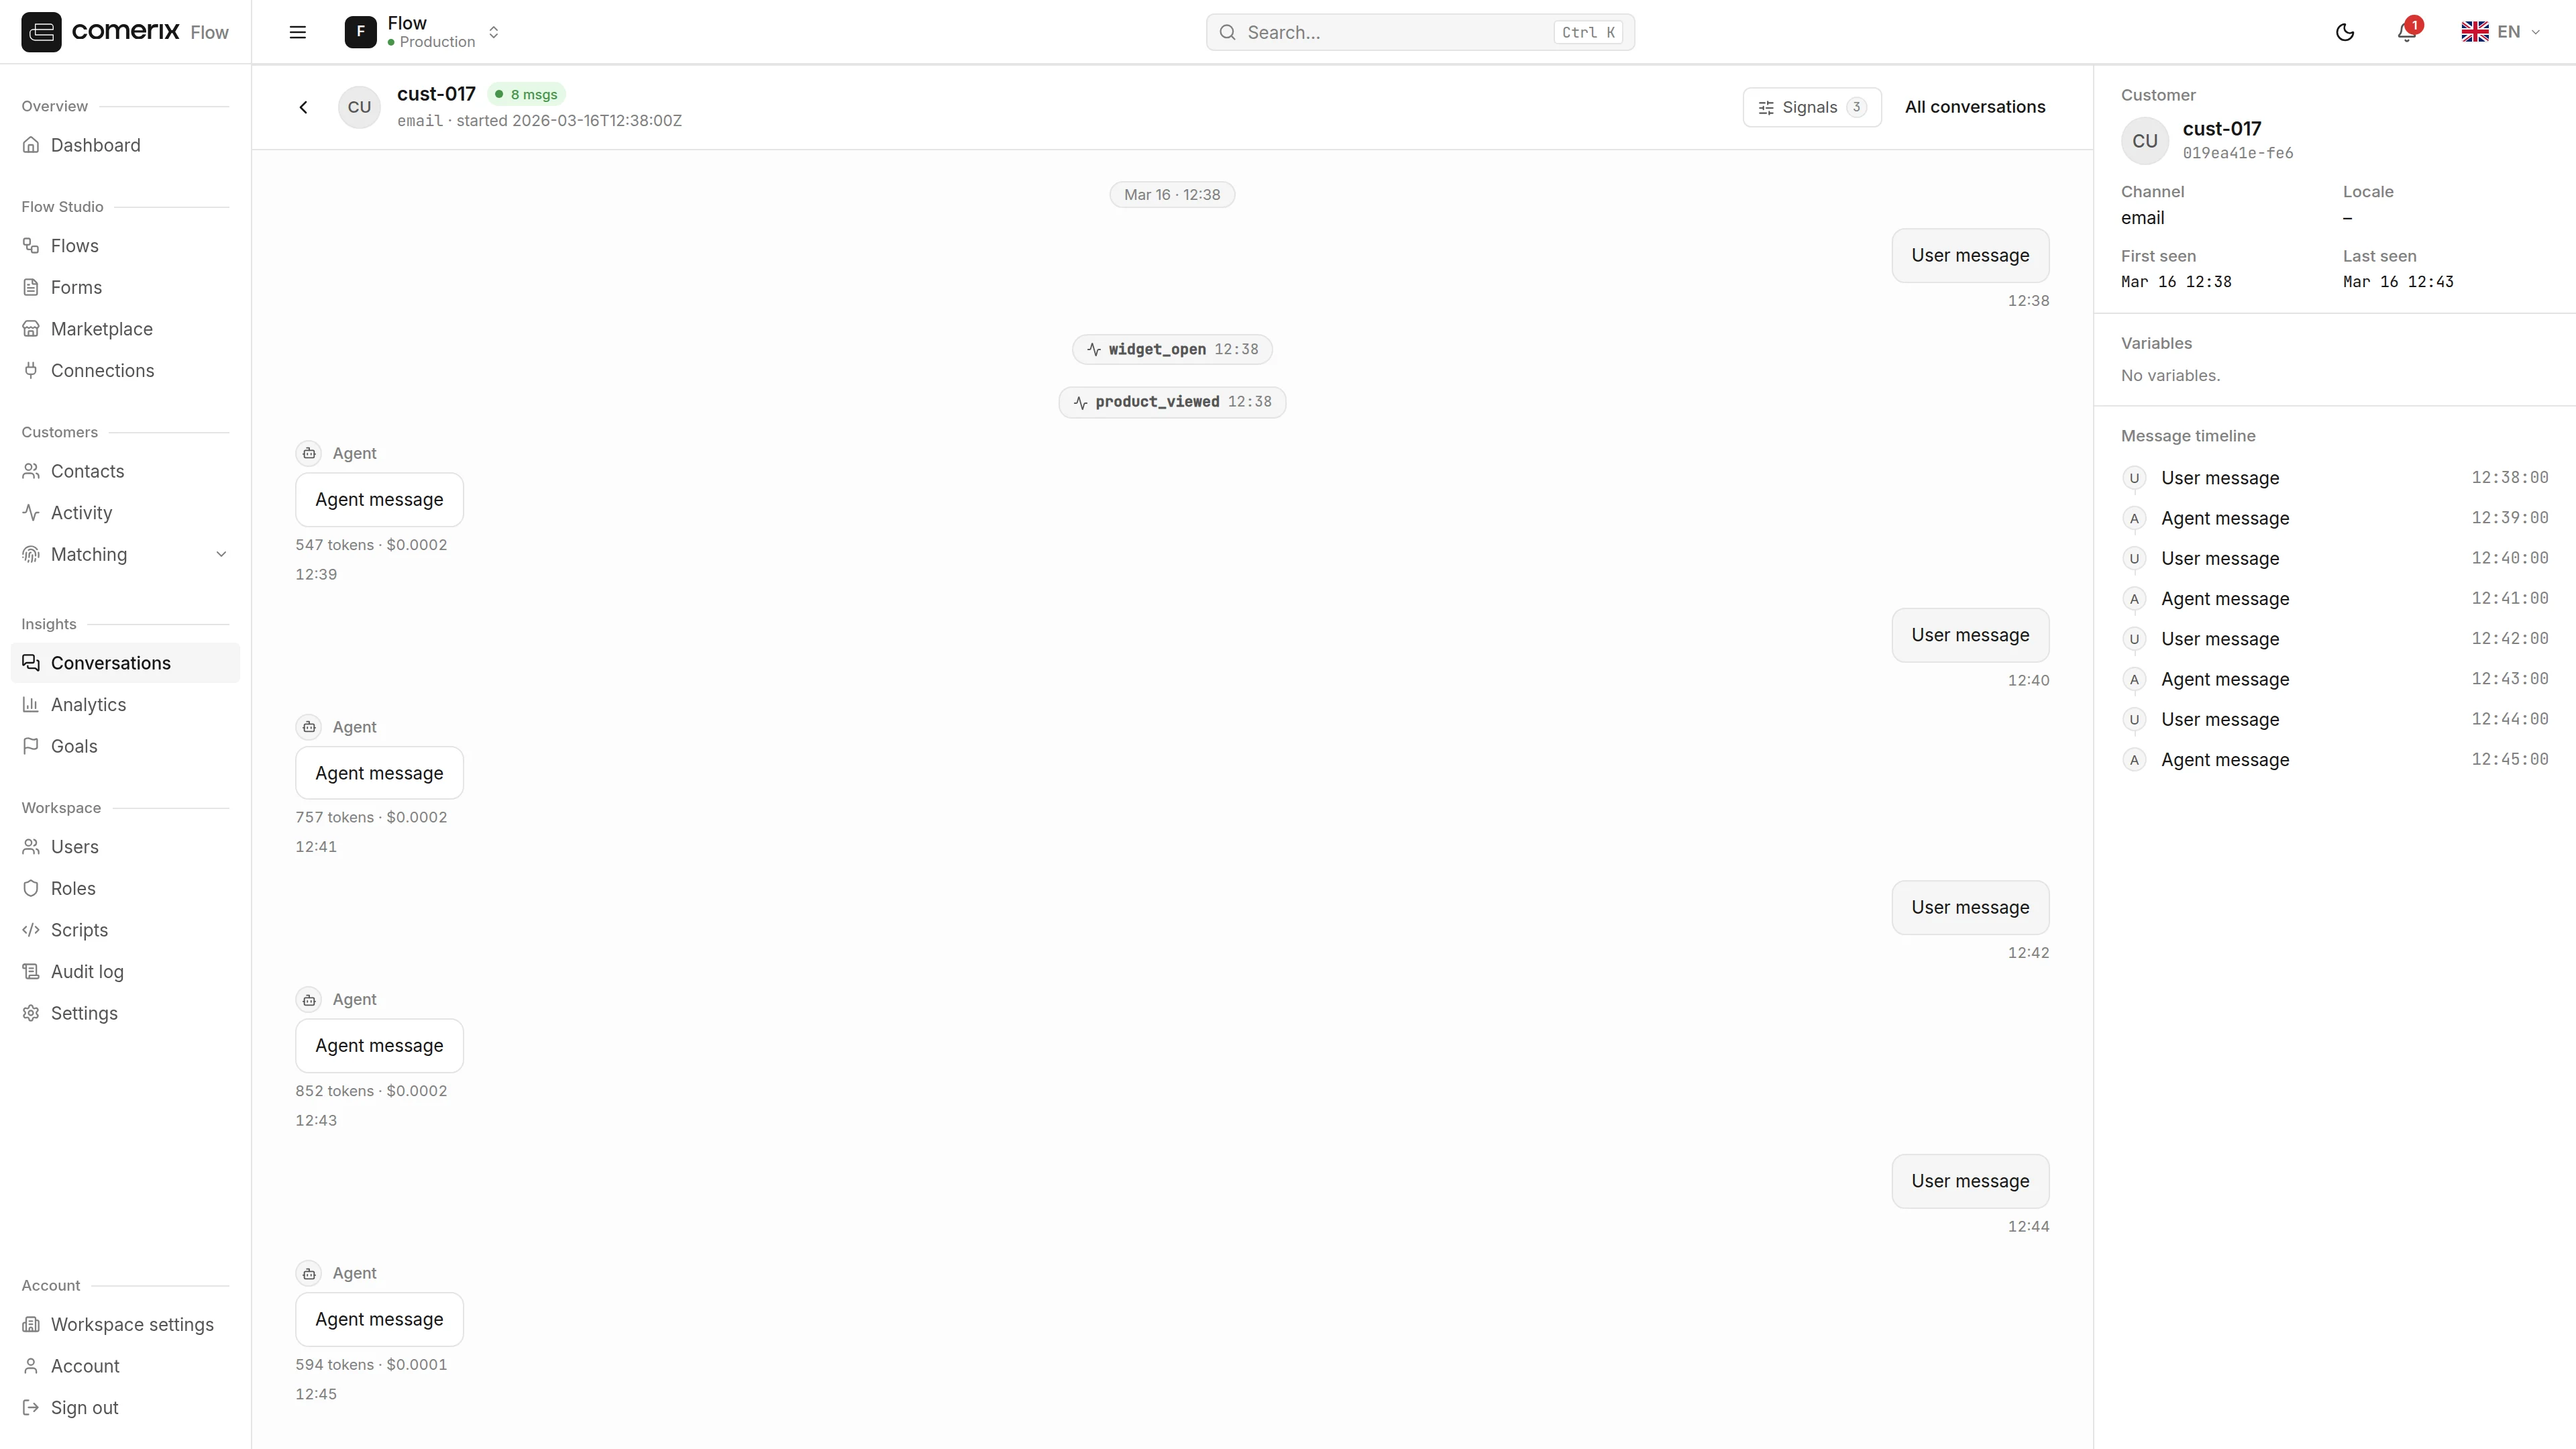
Open any row to reach the conversation detail (/admin/transcripts/conversations/{id}). It shows the complete thread in order:
- Transcript — user, agent, and system messages, each with a timestamp.
- Form requests — inline form prompts shown to the customer, with the field values they submitted.
- Token usage — where a message was produced by a model, a small badge under the bubble shows its token count and cost (for example
42 tokens · $0.0012). Hover the badge to see which model generated the message. Messages with no recorded usage show no badge. - Telemetry — widget telemetry events folded into the timeline where they occurred.
Browse executions
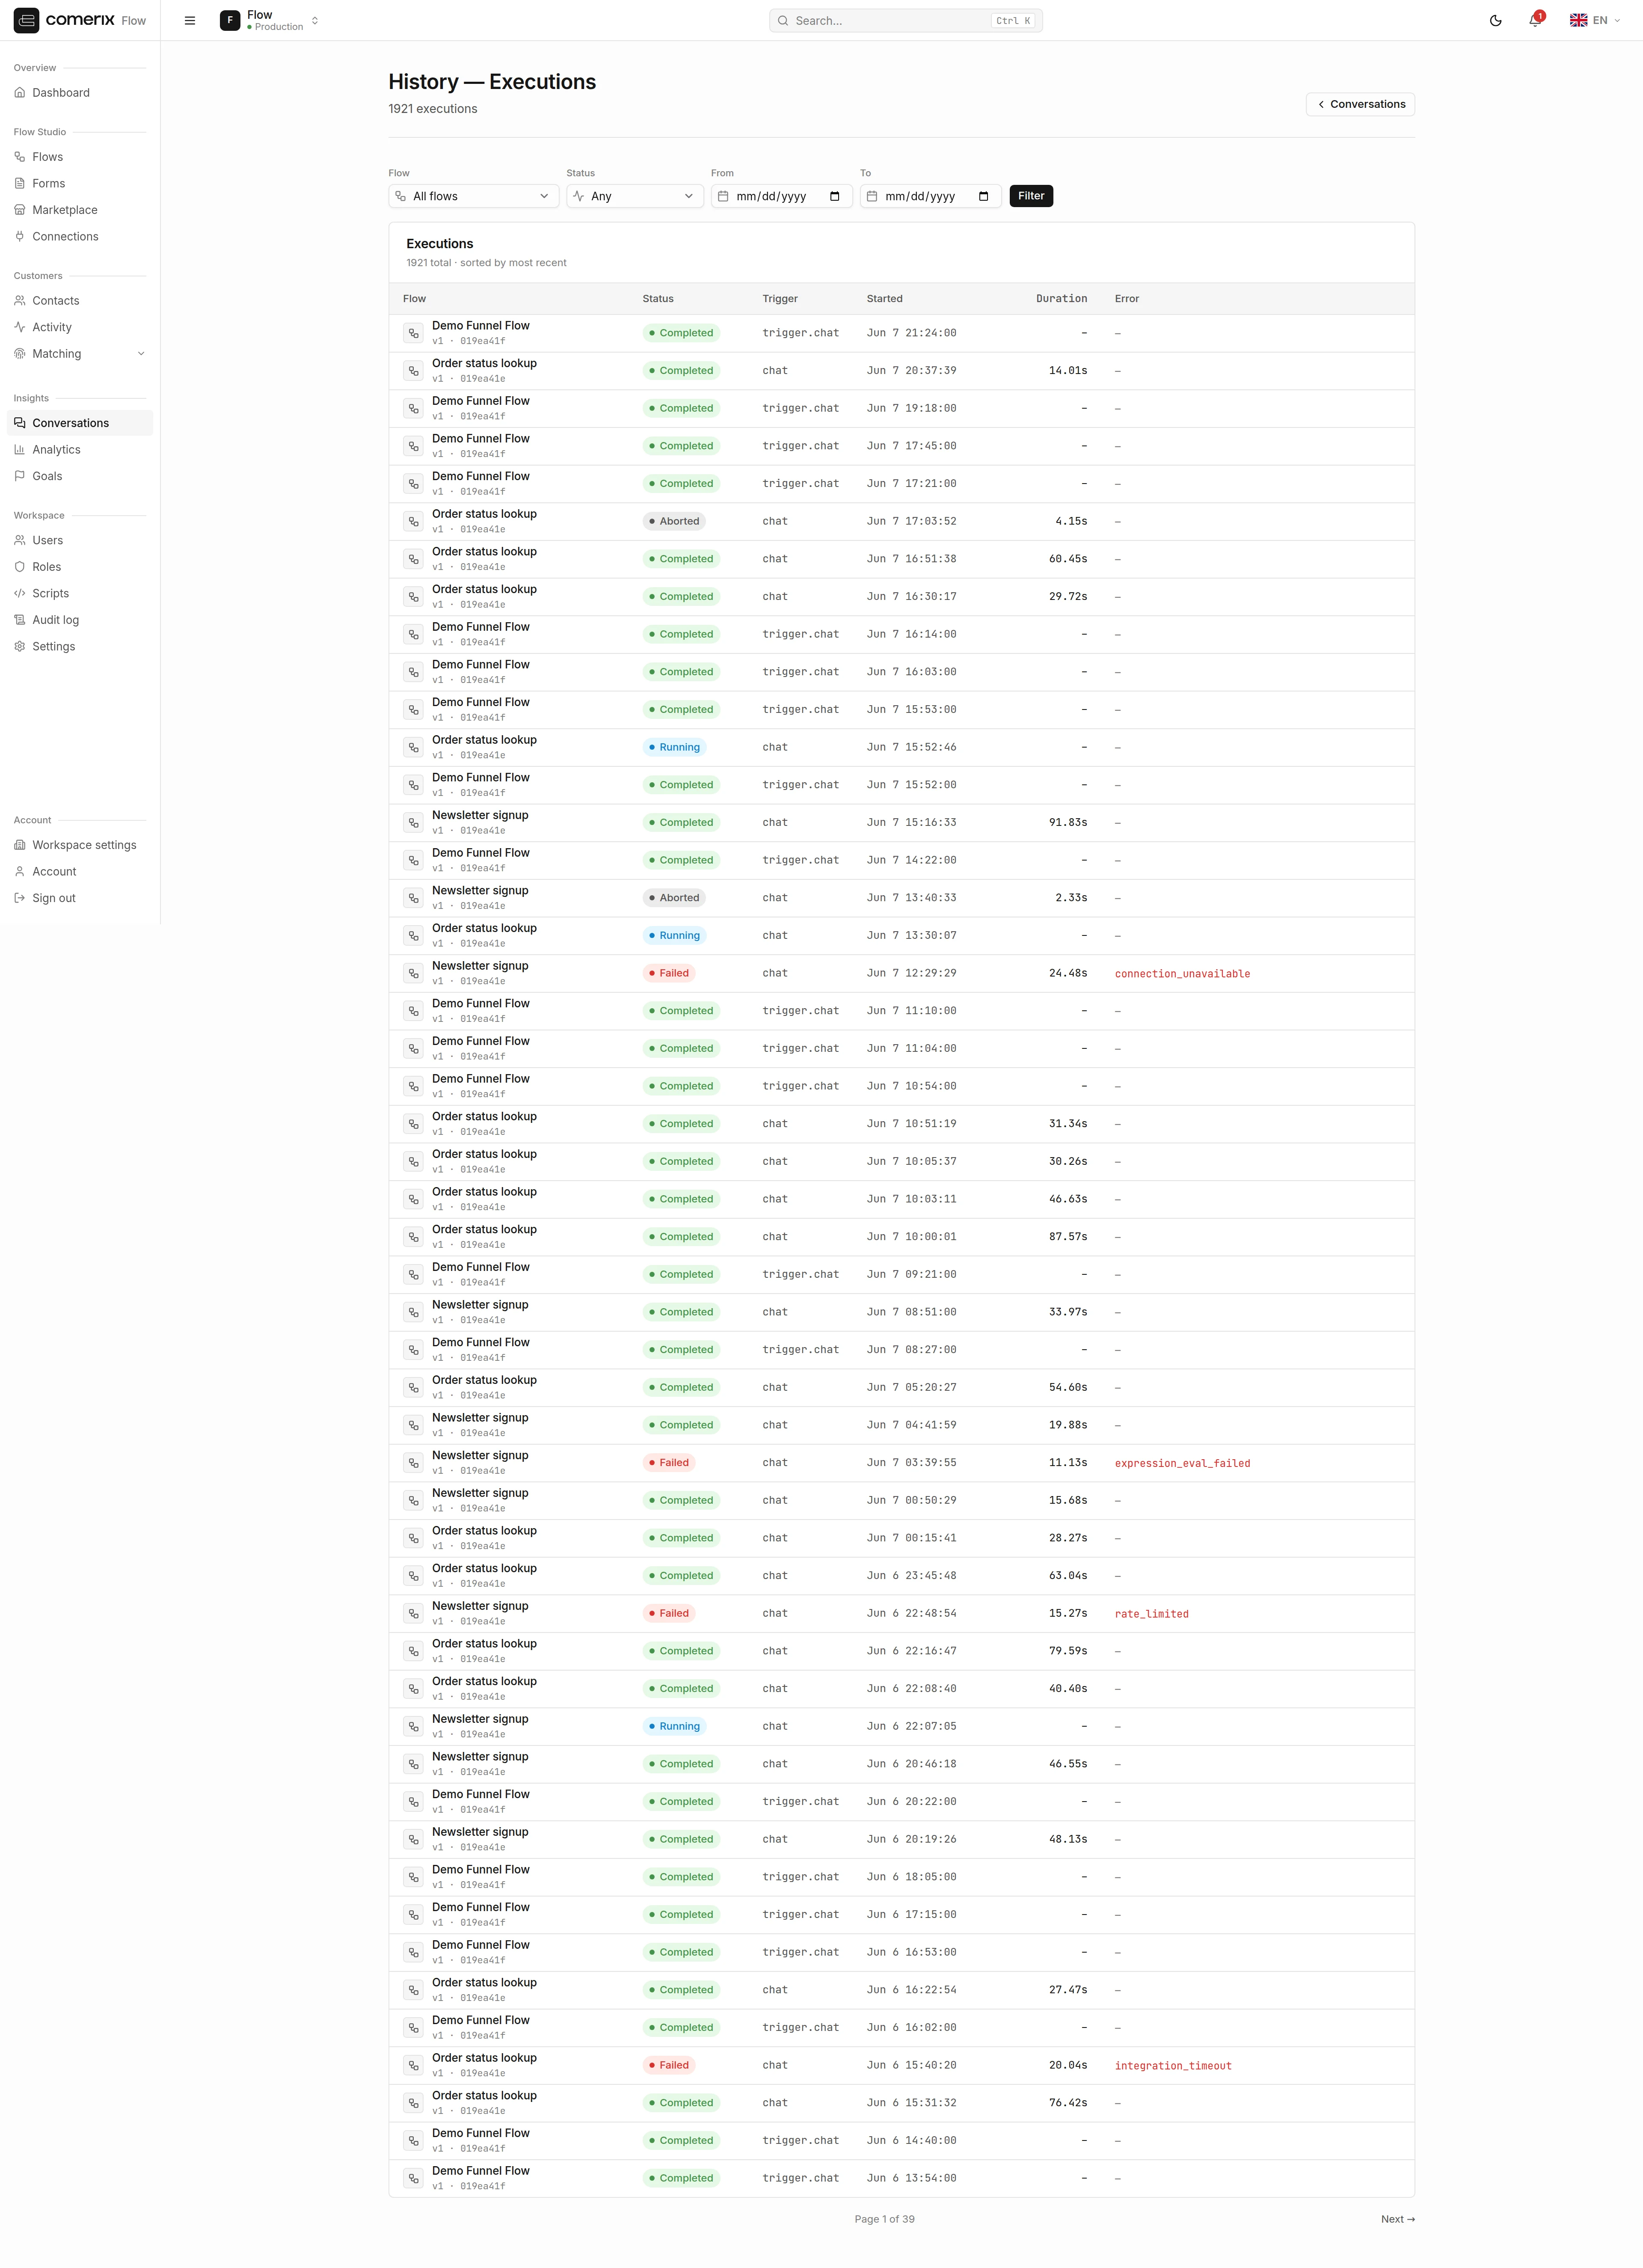
/admin/transcripts/executions, admin_transcripts_executions) to see flow runs directly. It is paginated at 50 per page and supports the same flow / status / date-range filters.
| Column | Meaning |
|---|---|
| Flow | The flow that ran — links to its editor |
| Status | Current run status (see Lifecycle) |
| Trigger type | What started the run |
| Started | When the run began |
| Duration | How long it took |
| Error code | Populated only for failed runs |
Debug a run
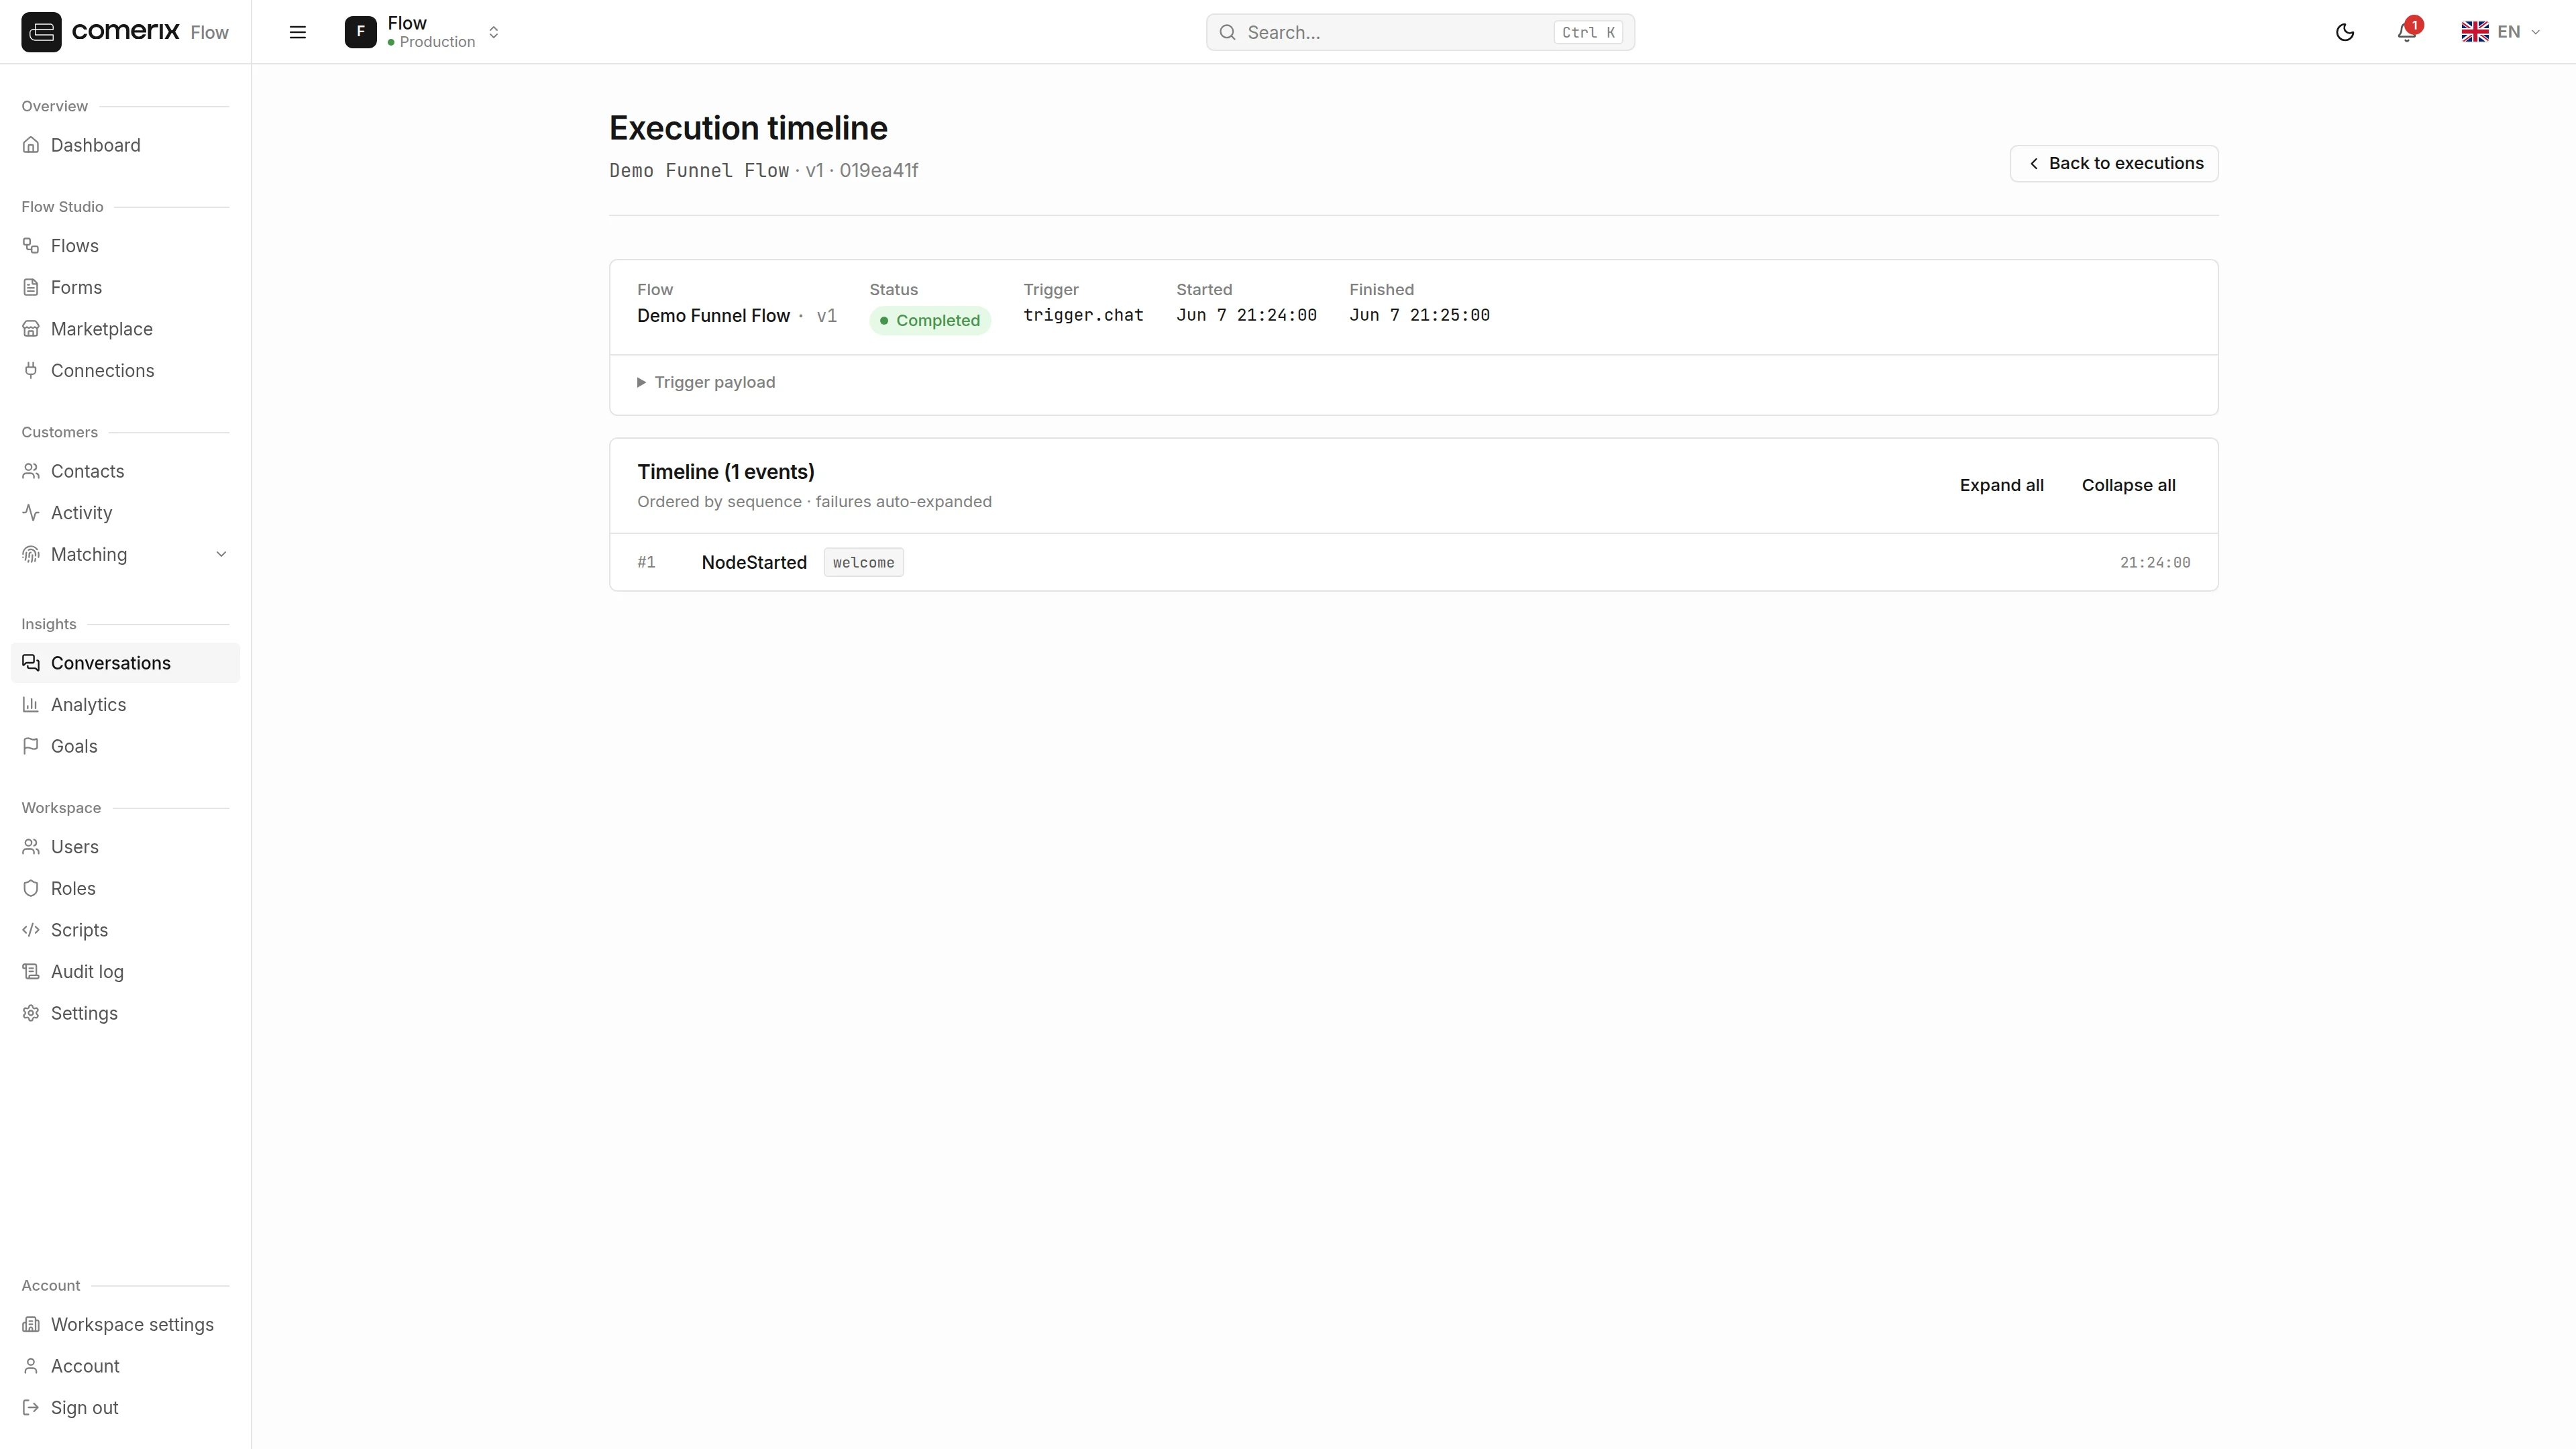
Open an execution to reach its detail page (/admin/transcripts/executions/{id}). This is the place to diagnose a failure.
The summary lists the flow, status, version, trigger, timestamps, duration, and error (if any), followed by the trigger payload that started the run.
Below that is the ordered event timeline — the full step-by-step record of the run:
| Event | When it appears |
|---|---|
NodeStarted / NodeCompleted | A node began / finished successfully |
NodeFailed | A node raised an error |
NodeSkipped | A node was bypassed by branch logic |
WaitScheduled / WaitFired | A wait was queued / resumed |
FormDisplayed / InputReceived | A form was shown / answered |
ExecutionPaused | The run paused (e.g. waiting on input or time) |
ExecutionCompleted / ExecutionFailed / ExecutionAborted | The run ended |
- Click any row to expand it and see its output or error JSON.
- Failed rows auto-expand so the error is visible immediately.
- Each node event deep-links to the node in the canvas, so you can open the exact step that misbehaved.
Permissions
| Action | Permission |
|---|---|
| View conversations, executions, and all detail pages | comerix.insights.history |
comerix.insights.history. Users without it won’t see the History entry in the Insights menu.